bong_tangent スケジューラーの特徴
カテゴリ:deeplearning
シグモイドスケジューラーのような S 字型のスケジューラーで、ノイズが多め。なのでディティールが豊富になる。
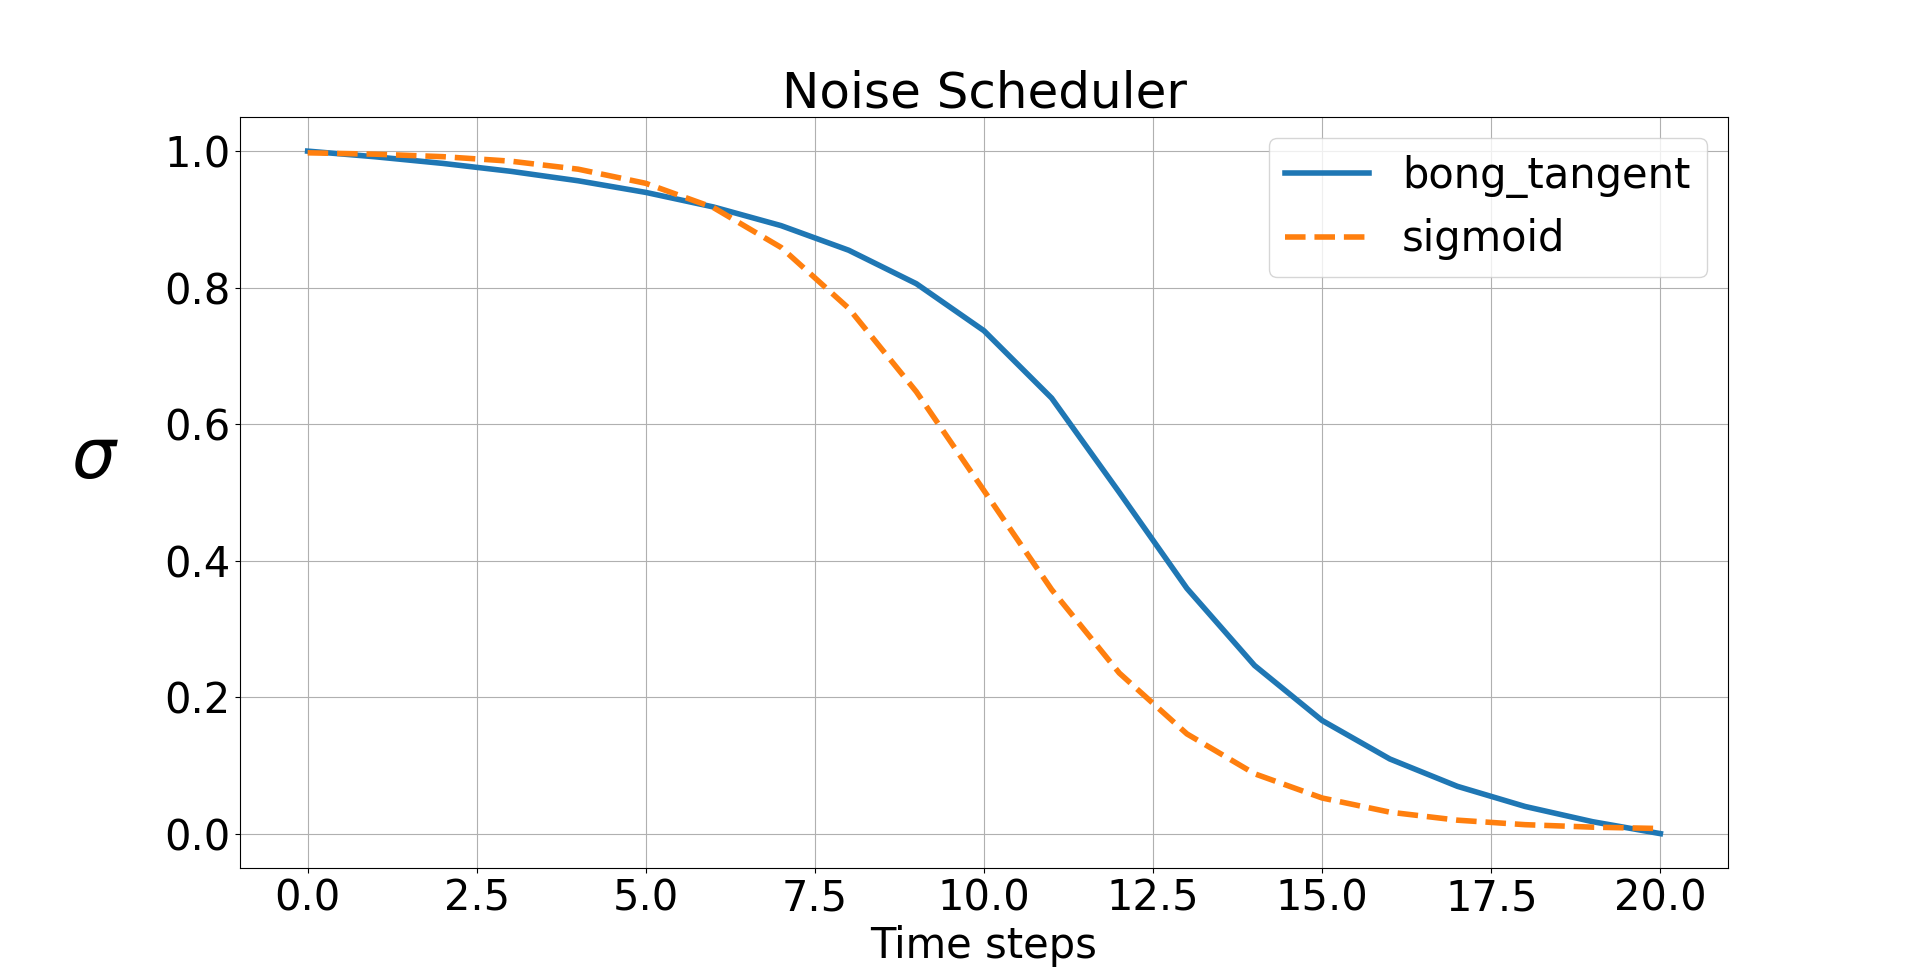
step 数 20 のときの
シグモイドと bong_tangent の比較
プロットコード
import math
import numpy as np
import matplotlib.pyplot as plt

# https://github.com/ClownsharkBatwing/RES4LYF/blob/a3999a56a650da5cffe9e8f9f8b115f764603620/sigmas.py#L4065

def get_bong_tangent_sigmas(steps, slope, pivot, start, end):
    smax = ((2/np.pi)*np.arctan(-slope*(0-pivot))+1)/2
    smin = ((2/np.pi)*np.arctan(-slope*((steps-1)-pivot))+1)/2

    srange = smax-smin
    sscale = start - end

    sigmas = [  ( (((2/np.pi)*np.arctan(-slope*(x-pivot))+1)/2) - smin) * (1/srange) * sscale + end    for x in range(steps)]

    return sigmas

def bong_tangent_scheduler(steps, start=1.0, middle=0.5, end=0.0, pivot_1=0.6, pivot_2=0.6, slope_1=0.2, slope_2=0.2, pad=False):
    steps += 2

    midpoint = int( (steps*pivot_1 + steps*pivot_2) / 2 )
    pivot_1 = int(steps * pivot_1)
    pivot_2 = int(steps * pivot_2)

    slope_1 = slope_1 / (steps/40)
    slope_2 = slope_2 / (steps/40)

    stage_2_len = steps - midpoint
    stage_1_len = steps - stage_2_len

    tan_sigmas_1 = get_bong_tangent_sigmas(stage_1_len, slope_1, pivot_1, start, middle)
    tan_sigmas_2 = get_bong_tangent_sigmas(stage_2_len, slope_2, pivot_2 - stage_1_len, middle, end)

    tan_sigmas_1 = tan_sigmas_1[:-1]
    if pad:
        tan_sigmas_2 = tan_sigmas_2+[0]

    tan_sigmas = tan_sigmas_1 + tan_sigmas_2

    return tan_sigmas


def sigmoid(steps):
    scale = 1000 / steps
    beta_start = scale * 0.0001
    beta_end = scale * 0.02
    betas = np.linspace(-6, 6, steps+1)
    return (1/(np.exp(betas) + 1)) * (beta_end - beta_start) + beta_start

plt.rcParams["font.size"] = 30
fig, ax = plt.subplots()
ax.set_xlabel('Time steps')
ax.set_title(r'Noise Scheduler') # グラフタイトル
ax.grid()            # 罫線
plt.ticklabel_format(style='plain', axis='x')   # X 軸は整数

line_width = 4
steps = 20
ax.set_ylabel(r'$\sigma$', rotation=0, labelpad=50, fontsize=50)
ax.plot(np.linspace(0, steps, steps+1), bong_tangent_scheduler(steps=steps), label="bong_tangent", lw=line_width)
ax.plot(np.linspace(0, steps, steps+1), sigmoid(steps=steps), "--",  label="sigmoid", lw=line_width)

ax.legend(loc=0)    # 凡例
plt.show()